Research Article | | Peer-Reviewed

Non-Performing Assets (NPA’s) – Impact on Financial Stability of Indian Commercial Banks

Received: 28 September 2024     Accepted: 23 October 2024     Published: 13 November 2024
Views:       Downloads:
Abstract

For any economy credit is required for faster growth, but any outstanding advances may turn macroeconomic shocks. There can be various reasons for Non-Performing Assets (NPA) like low scrutiny by banks, wilful defaulter, low earnings affecting ability of entities to pay back loans, economic slowdown, government policies etc. This study aims to bridge this gap by analysing the performance and impact of NPA’s on the State Bank Of India (SBI) top public commercial bank by market capitalisation and HDFC Bank, a top private bank according to market capitalisation. For the current study, HDFC and SBI bank was considered and data for the study was collected using secondary source, i.e. annual reports. The data was collected in a time series format for different financial variables. Keeping Net NPA to Net Advances as an independent variable and Net Profit/Income Ratio and ROA as dependent variable hypothesis was formed. As per the findings, NPA significantly impact profitability of Banks’ and Debt to Asset Ratio. The impact of NPA was found to be more profound in the SBI than HDFC, but it was observed that SBI’s NPA is better managed than that of HDFC, since it made more provisions for NPA, had better loan structures and profitability metrics. It is suggested that Private Commercial Banks can maintain more provisions for NPA and better utilization of assets to reduce their Debt to Asset Ratio to mitigate the negative affect of NPA.

Published in International Journal of Finance and Banking Research (Volume 10, Issue 5)
DOI 10.11648/j.ijfbr.20241005.12
Page(s) 92-103
Creative Commons

This is an Open Access article, distributed under the terms of the Creative Commons Attribution 4.0 International License (http://creativecommons.org/licenses/by/4.0/), which permits unrestricted use, distribution and reproduction in any medium or format, provided the original work is properly cited.

Copyright

Copyright © The Author(s), 2024. Published by Science Publishing Group

Keywords

Non-Performing Assets, Banking, Profitability, Return on Assets, Private Sector Bank, Public Sector Bank

1. Introduction
Banking plays a crucial role in the Indian economy, serving as the backbone for financial stability and growth. Gross domestic savings in India were reported at 30.24% in 2023 and in last 15 years have declined by 7.5% as shown in figure 1 (1). Economists believe that the main reason for this is jump in household debt is because households increasingly rely on debt to fuel consumption which erodes their savings. As of 2024, annual borrowings stood at 5.8% of GDP, the second highest level recorded since the 1970’s. It was found out that Indian households have Debt Service Ratio (DSR) of approximately 12% which is higher than the economies of China, France, UK and US. These phenomena may be due to higher interest rates and shorter loan tenures prevalent in the Indian economy, which results in higher DSR despite lower debt to income ratio and may further lead to Non-Performing Assets (NPA) in India’s Commercial Banks.
Source:

Download: Download full-size image

Figure 1. Gross Domestic Saving Rate in India.
Non-Performing Assets (NPA) have become a significant concern for Commercial Banks globally, impacting their profitability and operational efficiency. In Banking, an asset is categorized as NPA when it ceases to generate income for the lender as per pre-decided payment schedule. The Reserve Bank of India (RBI) has defined NPA as assets for which both the repayment of principal and interest remains overdue for a period surpassing ninety (90) days. Further the RBI, has sub-classified NPA’s into three distinct categories:
1) Substandard Assets
2) Doubtful Assets, and
3) Loss Assets
An asset is considered ‘substandard’ if it retains its NPA status for a duration of up to twelve months, while an asset falls under the ‘doubtful’ category if it sustains its NPA status for more than twelve months. A ‘loss’ asset denotes that the associated loss has been acknowledged, yet the precise amount has not been expunged. The combination of these three varieties of assets constitutes the entirety of NPA within a given bank . Managing NPA’s is crucial for the health of banks and the broader economy. Effective strategies for early detection, monitoring, and resolution are essential to minimize the impact of NPA. India Non-Performing Loans Ratio stood at 3.9% in Mar 2023, compared with the ratio of 5.8% in the previous year indicating an improvement in interventions by Commercial Banks, RBI and Government (Figure 2).
Source: -

Download: Download full-size image

Figure 2. Scheduled Commercial Banks: Non-Performing Loans Ratio.
The status of Non-Performing Assets (NPA) in India has shown significant improvement over recent years. As of March 2023, the Gross NPA (GNPA) ratio of scheduled commercial banks had decreased to 3.9%, a ten-year low. According to ICRA rating agency, this trend is expected to continue, with projections indicating a further decline to 3.6% by March 2024. Key factors contributing to this improvement include higher loan growth, a decline in slippages (new NPA), better recoveries, and write-offs of bad loans . There has been a substantial reduction of NPA in the corporate segment with an expectation that it will further fall to around 2% by the end of Fiscal 2023-24. Additionally, the retail loan segment has maintained a relatively low NPA ratio of around 1.4% as of March 2023, although the share of 'Special Mention Accounts' (defined as loans that are overdue but not yet classified as NPA as per RBI guidelines) is relatively high at 7.4%. The MSME segment, however, continues to face challenges, with stressed loans projected to remain elevated .
It is known that the prevalence of high NPA can negatively impact a bank's profitability and future prospects since they require banks to allocate a significant portion of their profits for loan provisioning thereby reducing profitability and eroding net worth. Moreover, NPA leads to lower Return on Asset (ROA), indicating lower profitability and less efficient asset utilization. This can affect a bank's financial health and hinder its ability to raise funds and attract investments for future growth. Additionally, NPA can hinder lending practices, affecting credit growth and overall economic growth in the country . The rising levels of NPA have led to extensive research and debate over which type of bank—public or private - is more adversely affected. Different studies present varying outcomes, creating ambiguity about the real impact of NPA. For instance, some research indicates that Public Sector Banks (PSB’s) face higher NPA due to more extensive social banking obligations and political influences while other studies suggest that Private Sector Commercial Banks (PCB’s) are equally vulnerable due to aggressive lending practices and under-reporting of NPA’s . According to research conducted using data collected from RBI’s website, the growth rate of NPA in India’s privately owned commercial banks is low compared to that in the state-owned Public Sector Banking and Financial Services Bodies such as State Bank of India (SBI) and its associate Nationalized banks. SBI and other Nationalized Banks failed to handle such issue of poor loans effectively due to which the growth in such loan has been high . Study has also revealed that for Indian banking sector high negative correlation exists between NPA and two profitability measures like Return on Assets (ROA) and Return on Equity (ROE). Declining credit quality hampers banks performance and which can lead them to collapse .
A comparative analysis that specifically examines the impact of NPA on a leading Private Commercial Bank and Public Commercial Bank in India in recent years can be analysed. This study aims to bridge this gap by specifically analysing the performance and impact of NPA’s on the State Bank Of India (SBI) top public commercial bank by market capitalisation and HDFC Bank, top private bank according to market capitalisation .
The primary objective of this paper is to compare the effects of NPA on the financial performance of SBI and HDFC Bank. By examining key financial metrics such as Return on Assets (ROA), Net Profit, and Capital Adequacy Ratio. The study seeks to determine which sector of bank (Private or Public) is more significantly impacted. This comparative analysis will provide insights into the effectiveness of NPA management strategies in both public and private sector banks.
1.1. NPA’s in HDFC Bank
HDFC Bank, one of India's largest private sector banks, has faced significant challenges related to NPA over the years. The trend of NPA in HDFC Bank has shown fluctuations over the years. From 2005 to 2024, the Net NPA ratio has varied, peaking in the years following the global financial crisis of 2008 and showing a gradual decline and subsequent fluctuations thereafter. The data indicates that HDFC Bank has made significant efforts to manage and reduce NPA, although challenges remain. The Net NPA ratio shows fluctuations over the years, indicating varying degrees of success in managing NPA. The ratio was highest at 0.63% in 2008-09, reflecting the impact of the global financial crisis, and it dropped to 0.18% in 2011-12 before rising again to 0.40% in 2017-18 and stabilizing around 0.33% in 2023-24 (Figure 3).
Source: -

Download: Download full-size image

Figure 3. HDFC Bank Net NPA to Net Advances.
The COVID-19 pandemic significantly impacted NPA levels in banks worldwide, including those of HDFC Bank. The provision coverage ratio (PCR) saw a substantial increase in the year 2020-2021, reflecting the bank's efforts to cover potential loan defaults during the pandemic. This ratio then decreased slightly in 2021-2022, indicating some stabilization post-pandemic .
1.2. NPA’s in SBI Bank
Source: -

Download: Download full-size image

Figure 4. SBI Bank Net NPA to Net Advances.
Figure 4 illustrates the Net NPA to Net Advances ratio for the State Bank of India (SBI) from 2008-09 to 2023-24. The ratio saw a significant spike, peaking at around 6% in the year 2017-18. This sharp increase indicates a substantial rise in NPA, possibly due to aggressive lending practices, economic slowdown, and the impact of regulatory changes such as the Asset Quality Review (AQR) initiated by the Reserve Bank of India (RBI) in 2015. The primary purpose was to identify and transparently recognize NPA that had been hidden under various restructuring schemes. The AQR revealed a high incidence of NPA, leading to significant reclassification of stressed accounts as NPA’s. This transparent recognition caused gross NPA for PSB’s to surge from ₹2,79,016 crore in March 2015 to ₹8,95,601 crore in March 2018 .
Following the AQR, the government implemented a comprehensive 4R’s strategy—Recognition, Resolution, Recapitalization, and Reforms—to address the NPA crisis. This strategy included the introduction of the Insolvency and Bankruptcy Code (IBC) 2016 for effective resolution, recapitalizing PSBs to strengthen their balance sheets, and instituting key banking reforms. These measures led to a decline in NPA’s to ₹7,89,569 crore by March 2019 and facilitated a record recovery of ₹3,16,479 crore over four years. The AQR and subsequent reforms significantly improved the transparency and health of the Indian banking sector. Hence, Following the peak, there was a significant decrease in the ratio, dropping from around 6% in 2017-18 to approximately 2% in 2019-20. The ratio continued to decline, stabilizing around 1% by 2023-24. This period reflects continued efforts by SBI to manage and reduce NPA’s through better risk management practices, recovery strategies, and a favorable economic environment.
2. Literature Review
A number of studies have examined Non-Performing Assets (NPA) in the banking sector, focusing on their causes, impacts, and management strategies. This part of the paper reviews relevant research on NPA’s in public and private sector banks in India in thematic style.
2.1. NPA and Economy
Systematically reviews the literature on NPA’s in India, identified major determinants and explored further research scope. The findings showed that NPA in public sector banks have been rising faster than in private sector banks, with key determinants including macroeconomic factors, corporate governance practices, and lending norms . Complementing this impact of macroeconomic and endogenous factors on NPA in Indian banks revealed that macroeconomic factors such as GDP growth, inflation, and interest rates significantly affect NPA levels, while endogenous factors like bank-specific policies, credit appraisal systems, and management practices also play crucial roles . Built on this relationship was examined between NPA and GDP growth in India, identifying global financial crises, weak demand, and rising prices as key factors. The study found a positive impact of NPA’s on GDP growth, suggesting insufficient real economic improvement to reduce NPA’s, and advocates for strategic policy measures, including stabilization programs and expansionary fiscal policies, to manage NPA’s and support economic growth .
A comparative analysis revealed that public sector banks exhibit higher NPA’s due to socio-political pressures and extensive priority sector lending, while private sector banks manage NPA’s better but face challenges from aggressive lending practices . This finding is echoed by Agarwala (2019) who assessed the impact of different groups of banks, including State Bank of India (SBI) and its associates, nationalized banks, and private sector banks, on the banking industry regarding NPA’s. The study finds that the growth rate of NPA’s in private sector banks was lower compared to nationalized banks and SBI associates, with poor handling of loans by nationalized banks and SBI associates resulting in a significant increase in NPA’s . Deepak (2019) further reinforces this by revealing that the NPA level is higher in public sector banks compared to private sector banks, emphasizing the need for discretion and flexibility in resolving NPA’s by allowing banks to formulate their own ground rules, and highlighting the potential positive impact of the Insolvency & Bankruptcy Law 2016 and Prompt Corrective Action on managing NPA’s in the banking sector .
Broadening the scope to emerging trends, examined the impact of information and communication technology (ICT) on Indian banks' profitability, focusing on Net Interest Margin (NIM). It was found out that ICT investments can enhance long-term profitability and emphasizing the importance of employee education to manage risks. looks at the connection between country risk and non-performing loans (NPL’s) in the banking sectors of BRICS emerging economies, showing that country risk, especially political risk, increases credit risk in the banking sectors, with other factors like financial market development, lending interest rate, and global risk also contributing to the rise in NPL’s. Finally, evaluates the financial fragility and vulnerability of banks in the Chinese finance market, proposing an evaluation index system based on indicators such as capital adequacy and non-performing loans, revealing that the Bank of Ningbo had the lowest vulnerability score, while China Minsheng Bank had the highest score, highlighting the importance of a good economic environment for the stability of the financial system.
2.2. NPA and Financial Performance
Effect of non-performing loans (NPL) and loan to deposit ratio (LDR) on return on assets (ROA) in the banking industry, using data from bank sub-sector companies listed on the Indonesia Stock Exchange from 2017 to 2019 was analysed. The results show that both NPL and LDR significantly impact ROA, with a higher LDR leading to a higher ROA, while a higher NPL leads to a lower ROA . This aligns with another study which examined the impact of corporate governance factors on the profitability of Indian public sector banks, considering variables such as the proportion of female directors, chairman change, total remuneration, total committees, cost to income ratio, gross NPA’s ratio, and provision coverage ratio. The study finds that total remuneration positively impacts bank performance, while other factors such as chairman change and gross NPA’s ratio negatively impact performance . Similarly, a study also examined the impact of NPA’s on the financial performance of selected public and private sector banks in India, revealing a significant positive impact of gross NPA’s (GNPA’s) and Net NPA’s (NNPA’s) on the financial performance of public sector banks. According to results, there was no significant impact on the financial performance of private sector banks . Adding to this, the impact of NPA’s on the performance indicators of banking institutions, focusing on the top five banks in India based on market capitalization from FY 2014-15 to FY 2018-19 was examined. The findings reveal a significant negative correlation between NPA’s and banking performance, indicating that higher NPA’s lead to reduced profitability and increased operating expenses .
Turning to regional and sectoral studies, analyses the trend of NPA’s in Tripura Gramin Bank (TGB) over a 10-year period, identifying factors contributing to the increase in NPA’s and providing suggestions to mitigate the NPA issue. There is a positive correlation between the NPA’s and total advances of TGB, highlighting the importance of proper credit appraisal and maintenance of the ratio between advances and NPA growth. In a similar vein, examines the relationship between the ability to manage assets and the decision to purchase non-performing assets, emphasizing the importance of asset management for buyers of non-performing loans and non-performing asset management companies. Additionally, examines the comparative performance of non-performing assets among three selected Non-Banking Financial Companies (NBFC’s) in India: Bajaj Finance, Muthoot Finance, and Reliance Capital. The findings suggest that Muthoot Finance had better revenue generation and lower NPA values compared to the other two NBFC’s, identifying a significant positive correlation between revenue generation and NPA’s, while a negative correlation is observed between Return on Assets (ROA) and NPA’s.
For any economy credit is required for faster growth, but any outstanding advances may turn macroeconomic shocks. There can be various reasons for NPA’s like low scrutiny by banks, wilful defaulter, low earnings affecting ability of entities to pay back loans, economic slowdown, government policies etc. The NPA and other financial data of 40 schedules commercial banks -public and private sectors for the time period 2005 till 2018 was collected to analyse the impact of NPA’s on their financial performance. It was found out that NPA’s have a significant negative impact return on assets and return on equity. It was also observed that net interest margin and non-interest income have a positive effect on banks profit and rising wage bill will have a negative impact on return on equity and return on assets . Using the data of 7 public sectors banks the connection between Gross NPA’s and Net NPA’s was examined. There is a negative relationship between their Gross NPA’s and net benefits and State Banks of India and Punjab National Banks net profit is not influenced by Gross NPA’s. They focus on their NPA’s to recuperate their forthcoming credits . This was supported by another study which revealed that NPA’s have an adverse relationship between with profitability during the period 2009-10 till 2018-19. It was also found that change in profits can be explained till 70% for SBI and 62% for Bank Of Baroda (BOB) due to change in level of NPA’s . Using panel regression model, it was found out that credit variables such as interest rate, maturity and collateral and bank specific variables has a significant effect on bank’s non-performing loans. It was found out that credit variable has a significant impact on bank’s management of business cycle impact on loans and credit risk . Sectoral disparities in NPA’s ratio to advances in public and private sector are main source of motivation for non-performing assets. It was suggested that lack of frequent interaction, lack of follow-ups with borrowers, manipulation of income or financial statement, industrial problem and death of earning member are some of the reasons for NPA’s . Public sector Indian banks have larger percentage of Gross NPA’s and Net NPA’s. It was observed that SBI has shown good improvement in Return on assets (ROA) and Net NPA’s than private sector banks like Axis Bank and Kotak Mahindra Bank. Axis bank has improved its Return on Assets by keeping low NPA’s and Kotak Mahindra Bank has high ROA and well managed Net NPA. It was observed that if NPA’s decreases, the net profit increases . Using panel data regression, it was found out that there is a significant positive impact of interest income and age of the bank over financial performance of Indian Banking sector. Overall, Gross NPA’s has significant negative impact on financial performance and in case of public sector bank Gross NPA’s and interest income have significant impact on financial performance. Gross NPA and Age of Bank have significant impact on performance of private sector banks .
3. Objectives
Research has been conducted to analyse the impact of NPA’s on economy as a whole, financial performance on Indian banking sector. As per the literature analysis, no specific study was found for SBI bank and HDFC Bank NPA’s impact on its financial performance in the recent years. This study aims to: -
1) Identify variables impacting banks’ financial performance
2) Impact of NPA on the financial performance of SBI and HDFC Bank
3) Suggesting significant variables impacting the bank’s NPA’s
4. Research Methodology
For the current study, HDFC and SBI bank was considered and data for the study was collected using secondary source, i.e. annual reports . The data was collected in a time series format for different variables like net NPA’s to Net Advances, Net Profit/Interest Income, Capital Adequacy Ratio (CAR), Cost to Income Ratio, Loan to Deposit Ratio, Net Interest Margin, Return on Assets and Debt to Asset Ratio. Net NPA’s to net advances signifies how much total advances has not been recovered, net profit/interest income signifies difference between the revenue generated from banks interest bearing assets and the expenses associated by paying interest bearing liabilities. Capital Adequacy Ratio is the ratio of bank capital in relation to its Risk Weighted Assets and Current Liabilities. It is decided by central bank and bank regulators to prevent commercial banks from taking excess leverage and becoming insolvent. It is a ratio which measures the bank ability to absorb the losses and it is basically capital by risk weighted assets. As per the Basel III norms capital to risk weighted assets should be 8%, however as per RBI norms Indian scheduled commercial banks are required to maintain a CAR of 9% while public sector banks are emphasized to maintain a CAR of 12% . Cost to income ratio signifies how efficiently the bank is running, the lower ratio, more the profitable bank is and there is an inverse relationship between cost to income ratio and bank’s profitability. Loan to deposit ratio signifies how big a bank loan book relative to the size of its customer deposit base and net interest margin measures the net return on banks earning assets which includes investment securities, loans and lease. It signifies amount of money bank is earning in interest on loan compared to its paying in interest on deposit . Return on Assets signifies how profitable a banks’ asset are in generating revenue and debt to asset ratio reveals how much debt banks carries compared to the value of its own assets .
5. Descriptive Statistics for SBI and HDFC
For the study the data of these key financial variables were collected for the year 1997-98 till 2022-23 for HDFC bank and 2006-07 till 2023-24 for SBI bank. The descriptive statistics for SBI and HDFC bank are depicted in Table 1 and Table 2 respectively.
Table 1. Descriptive Statistics of SBI Bank.

Financial Variable

Mean

Median

Standard Deviation

Net NPA to Net Advances

0.021

.018

.012

Net profit/Interest Income

0.09

0.105

0.04

CAR - Tier I

0.10

0.09

0.002

CAR - Tier II

0.03

0.02

0.009

Cost to Income Ratio

0.02

.02

.005

Loan to deposit ratio

0.77

0.77

0.06

Net Interest Margin

0.025

0.024

0.0024

Return on Assets

0.017

0.006

0.0185

Debt to Asset Ratio

0.065

0.058

0.024

Table 2. Descriptive Statistics for HDFC Bank.

Financial Variable

Mean

Median

Standard Deviation

Net NPA to Net Advances

0.42

0.365

0.258

Net profit/Interest Income

0.24

0.215

0.075

CAR - Tier I

0.117

0.113

0.03

CAR - Tier II

0.0295

0.0293

0.013

Cost to Income Ratio

0.03

.03

.004

Loan to deposit ratio

0.69

0.75

0.172

Net Interest Margin

0.035

0.036

0.0061

Return on Assets

0.017

0.0184

0.0028

Debt to Asset Ratio

0.55

0.88

0.39

As per the Table standard deviation in HDFC bank for Net NPA to net advances and debt to asset ratio is more than SBI bank. This could be because SBI has enhances provisions for bad loans, sustained capital adequacy and increased profitability .
The stationarity of each series was tested using Augmented Dickey Fuller test in Eviews at 5% significance level. A stationary time series has statistical properties, such as mean, variance, and autocorrelation, that are constant over time . Stationarity is a crucial assumption for many time series forecasting methods. The data did not have any unit root. The following hypothesis were tested using time series multiple regression in Eviews (Table 3). Since, this study aims to analyze impact of NPA on the financial performance of SBI and HDFC bank the collected was arranged in timeseries format and stationarity of each variable was tested. The series of data was almost stationary and the following hypothesis was proposed to analyze the impact on the profitability.
Table 3. Proposed Hypotheses.

S.No.

Hypothesis

Probability Level

1

Ha: - Non-performing assets/net advances significantly predicts net profit/interest income

Ho: - Non-performing assets/net advances does not significantly predicts net profit/interest income

0.05

2

Ha: - Non-performing assets/net advances significantly predicts return on assets

Ho: - Non-performing assets/net advances does not significantly predicts return on assets

0.05

6. Data Analysis and Interpretation
Each hypothesis was tested at 5% significance level using EViews software for both the banks. The tested output for the first and second hypothesis for SBI bank is depicted in appendix – Table 4 and Table 5.
Both the hypothesis has been tested at 5% significance level after check the autocorrelation using Durbin Watson test and multicollinearity was tested using variance inflation factor. As per the output, Net NPA to Net Advance significantly impacts Net Profitability/Interest Income and Debt to Asset Ratio with a negative coefficient of -3.1 and 0.711 respectively. Whereas for Return on Assets for SBI banks does not significantly influences Net NPA to Net Advances, but influences Cost to Income Ratio at 5% significance level. The coefficient of Net NPA to Net Advances and Cost to Income Ratio, on return on assets is -0.22 and 6.53 respectively (tables 6 and 7).
For HDFC bank data, autocorrelation was tested using Durbin Watson test and multicollinearity was checked using variance inflation factor. As per the output Net NPA to net advances significantly impacts net profit/interest income and debt to asset ratio with a coefficient of -0.11 and -0.12 (Appendix – Tables 8 and 9). Whereas, Net NPA to net advances does not significantly impact return on assets and cost to income ratio at 5% significance level. The proposed equation for both the banks has been depicted in Table 4.
Table 4. Proposed Equation – SBI Bank.

SBI Bank

Equations

Hypothesis 1

Net profit/income ratio = 0.11 – 3.16(Net NPA/net advances) + 0.711 (Debt to asset ratio)

Hypothesis 2

ROA = -0.14 -0.22 (Net NPA to net advances) + 6.53 (cost to income ratio)

Table 5. Proposed Equation – HDFC Bank.

HDFC Bank

Equations

Hypothesis 1

Net profit/net income = 0.36 – 0.11 (Net NPA to net advances) – 0.12 (debt to asset ratio)

Hypothesis 2

ROA = 0.021 + 0.001 (Net NPA to net advances) – 0.166 (cost to income ratio)

Table 6. Hypothesis 1 for SBI Bank (SBI Bank -Dependent Variable – Net Profit/Interest Income).

Variable

Coefficient

Std. Error

t-Statistic

Prob.

C

0.115410

0.017753

6.501032

0.0000

NET_NPA_TO_NET_ADVANCES____

-3.163667

0.401071

-7.888052

0.0000

DEBT_TO_ASSET_RATIO

0.711646

0.205355

3.465446

0.0035

R-squared

0.849437

Mean dependent var

0.092653

Adjusted R-squared

0.829362

S.D. dependent var

0.049363

S.E. of regression

0.020391

Akaike info criterion

-4.796418

Sum squared resid

0.006237

Schwarz criterion

-4.648022

Log likelihood

46.16776

Hannan-Quinn criter.

-4.775956

F-statistic

42.31301

Durbin-Watson stat

1.411310

Prob (F-statistic)

0.000001

Table 7. Hypothesis 2 for SBI Bank (SBI Bank -Dependent Variable – Return on Assets).

Variable

Coefficient

Std. Error

t-Statistic

Prob.

C

0.115410

0.017753

6.501032

0.0000

NET_NPA_TO_NET_ADVANCES____

-3.163667

0.401071

-7.888052

0.0000

DEBT_TO_ASSET_RATIO

0.711646

0.205355

3.465446

0.0035

R-squared

0.849437

Mean dependent var

0.092653

Adjusted R-squared

0.829362

S.D. dependent var

0.049363

S.E. of regression

0.020391

Akaike info criterion

-4.796418

Sum squared resid

0.006237

Schwarz criterion

-4.648022

Log likelihood

46.16776

Hannan-Quinn criter.

-4.775956

F-statistic

42.31301

Durbin-Watson stat

1.411310

Prob (F-statistic)

0.000001

Table 8. Hypothesis 1 for HDFC Bank (HDFC Bank -Dependent Variable – Net Profit/Interest Income).

Variable

Coefficient

Std. Error

t-Statistic

Prob.

C

0.365584

0.039990

9.141899

0.0000

NET_NPA_TO_NET_ADVANCES

-0.115934

0.055857

-2.075545

0.0493

DEBT_TO_ASSET_RATIO

-0.127909

0.036399

-3.514100

0.0019

R-squared

0.352531

Mean dependent var

0.244512

Adjusted R-squared

0.296229

S.D. dependent var

0.075273

S.E. of regression

0.063147

Akaike info criterion

-2.578534

Sum squared resid

0.091714

Schwarz criterion

-2.433369

Log likelihood

36.52095

Hannan-Quinn criter.

-2.536732

F-statistic

6.261457

Durbin-Watson stat

0.585381

Prob (F-statistic)

0.006746

Table 9. Hypothesis 2 for HDFC Bank (HDFC Bank -Dependent Variable – Return on Assets).

Variable

Coefficient

Std. Error

t-Statistic

Prob.

C

0.021865

0.003744

5.839467

0.0000

NET_NPA_TO_NET_ADVANCES

0.001073

0.002186

0.490727

0.6283

COST_TO_INCOME_RATIO

-0.166239

0.113974

-1.458568

0.1582

R-squared

0.105409

Mean dependent var

0.017315

Adjusted R-squared

0.027618

S.D. dependent var

0.002824

S.E. of regression

0.002784

Akaike info criterion

-8.821469

Sum squared resid

0.000178

Schwarz criterion

-8.676304

Log likelihood

117.6791

Hannan-Quinn criter.

-8.779666

F-statistic

1.355035

Durbin-Watson stat

0.233219

Prob (F-statistic)

0.277768

7. Conclusion and Recommendation
As per this study NPA’s significantly impact profitability of Banks’ and Debt to Asset Ratio. The impact of NPA’s was found to be more profound in the PSB bank - SBI than the PCB - HDFC, but it was observed that SBI’s NPA is better managed than that of HDFC, since it made more provisions for NPA’s, had better loan structures and profitability metrics. It is suggested that PCB’s maintain more provisions for NPA’s and better utilisation of assets to reduce their Debt to Asset Ratio to mitigate the negative affect of NPA’s.
This study has analysed two Indian Commercial Banks, i.e. HDFC and SBI using publicly available historical data of 26 years and 18 years respectively to analyse effect of NPA’s on their financial performance. Future research studies can include more banks and financial variables and the scope of comparative performance can be extended to commercial banks of other countries in SAARC, ASEAN, G-20 etc.
Abbreviations

GDP

Gross Domestic Product

DSR

Debt Service Ratio

NPA

Non – Performing Asset

RBI

Reserve Bank of India

GNPA

Gross Non-Performing Assets

NNPA

Net Non-Performing Assets

ICRA

Investment Information and Credit Rating Agency

MSME

Micro, Small and Medium Enterprises

ROA

Return on Assets

PSB

Public Sector Bank

PCB

Private Sector Commercial Banks

SBI

State Bank of India

ROE

Return on Equity

HDFC Bank

Housing Development Finance Corporation

PCR

Provision Coverage Ratio

AQR

Asset Quality Review

IBC

Insolvency and Bankruptcy Code

ICT

Information And Communication Technology

NPL

Non Performing Loans

BRICS

Brazil, Russia, India, China, and South Africa

LDR

Loan to Deposit Ratio

TGB

Tripura Gramin Bank

NBFC

Non Banking Financial Companies

NIM

Net Interest Margin

BOB

Bank of Baroda

CAR

Capital Adequacy Ratio

SAARC

South Asian Association for Regional Cooperation

ASEAN

The Association of Southeast Asian Nations

Author Contributions
Dia Reddy Reddy Ganjikunta: Data curation, Investigation, Resources, Validation, Writing – original draft
Neharika Shrivastava: Conceptualization, Formal Analysis, Methodology, Project administration, Software, Supervision, Validation, Visualization, Writing – review & editing
Data Availability Statement
The data to support the finding of this study can be found at: -
SBI: https://sbi.co.in/web/corporate-governance/annual-report-
HDFC: - https://www.hdfcbank.com/personal/about-us/investor-relations/annual-reports
Conflicts of Interest
The authors declare no conflicts of interest.
References
[1] 
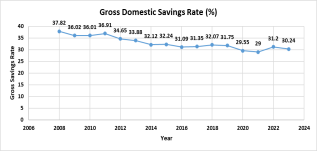
Trading Economics. (2024, August 14). India - Gross Domestic Savings (% Of GDP). Retrieved from
[2] Biswas, S. (2024, April 25). What's behind a dramatic fall in Indian families' savings. Retrieved from
[3] Dr. Vineeta Agrawal, D. A. (2023). Non-Performing Assets (NPA) in Indian Banking: Causes, consequences, and remedial measures. International Journal of Research in Management, 62-65.
[4] Harsh Kumar, A. L. (2024, April 11). Fresh NPAs of private, public banks to pick up in FY25, says ICRA. Retrieved from
[5] Varuna Agarwala, N. A. (2019). A critical review of non-performing assets in the Indian banking industry. Rajagiri Management Journal, 12-23.
[6] Dolly Gour, D. R. (2020). Non-performing Assets and Profitability: Case of Indian Banking Sector. Vision: The Journal of Business Perspective, 180-191.
[7] Agarwala, V. A. (2019). A critical review of non-performing assets in the Indian banking industry. Rajagiri Management Journal, 12-23.
[8] Mukherjee, S. (2019). Non-performing assets of banks and economicgrowth vinculum in the era of globalization: The Indian experience. INTERNATIONAL JOURNAL OF BUSINESS ECOSYSTEM & STRATEGY.
[9] Swamy, V. (2012). IMPACT OF MACROECONOMIC AND ENDOGENOUS FACTORS ON NON PERFORMING BANK ASSETS. The International Journal of Banking and Finance.
[10] Agarwala, V. A. (2019). A critical review of non-performing assets in the Indian banking industry. Emerald Insight.
[11] Dr. P. Dhanya, M. J. (2023). AN EMPIRICAL STUDY ON NON-PERFORMING ASSETS IN HDFC BANK. Coimbatore: International Research Journal of Modernization in Engineering Technology and Science.
[12] Shri Anurag Singh Thakur, M. o. (2019, January 21). PressReleasePage. Retrieved from
[13] Aniket Pundir, D. S. (2021). A Systematic Review on Non-Performing Assets in Banks in India. Turkish Journal of Computer and Mathematics Education, 9.
[14] Miyan, D. M. (2017). A Comparative Statistical Approach towards NPA of PSU and Private Sector Banks in India. International Journal of Advanced Research in Computer Science, 1-8.
[15] Deepak Tandon, N. T. (2019). Ballooning Non-Performing Assets in Indian Banking and Insolvency and Bankruptcy Code: Resolution Plans and Cases. International Journal of Political Activism and Engagement, 1-25.
[16] Niki Hadian, D. T. (2021). The Effect of Non-Performing Loans and Loan to Deposit Ratio on Return On Assets in the Banking Industry. Turkish Journal of Computer and Mathematics Education, 791-798.
[17] Aakash Singh, P. G. (2022). Impact of Corporate Governance Factors on the Profitability of Banks: A study on Indian public sector banks. Cardiometry, 699-707.
[18] Rashmi Kumari, P. K. (2017). Impact of Non-Performing Assets (NPAs) on Financial Performance of Indian banking Sector. IISUniv.J.Com.Mgt., 122-133.
[19] Nitin Tanted, R. G. (2021). A STUDY OF NPA AND ITS IMPACT ON BANKING PERFORMANCE. NLDIMSR Innovision Journal of Management Research, 15-25.
[20] Sentulal Debbarma, D. K. (2021). A study on analyzing the Non Performing Asset (NPA) level in Tripura Gramin Bank. Turkish Journal of Computer and Mathematics Education, 3026-3035.
[21] Devy M. Puspitasari, D. R. (2021). Does the Ability to Manage Assets Affect Non-Performing Asset Purchase Decisions? Turkish Journal of Computer and Mathematics Education, 445-451.
[22] Joseph Antony P, D. D. (2021). Study of Comparative Performance of Non-Performing Assets among Selected Leading Non-Banking Financial Companies of India. Turkish Journal of Computer and Mathematics Education, 1077-1085.
[23] Swapnilsingh Thakur, S. R. (2023). The Impact of ICT on the Profitability of Indian Banks: The Moderating Role of NPA. Journal of Risk and Financial Management, 1-16.
[24] Chafic Saliba, P. F. (2023). Does country risk impact the banking sectors’ non-performing loans? Evidence from BRICS emerging economies. Financial Innovation, 1-30.
[25] Li Shang, B. Z. (2024). Evaluating financial fragility: a case study of Chinese banking and finance systems. Humanities & Social Sciences Communications, 1-9.
[26] Mohan, S. (2022). IMPACT OF NPA ON PROFITABILITY OF SCHEDULED COMMERCIAL BANKS. IES OT -2022, 1-19.
[27] Ajjada Renuka, P. D. (2023). A STUDY ON IMPACT OF NON - PERFORMING ASSETS (NPAS) ON THE PROFITABILITY OF BANKS. Journal of Management, 26-33.
[28] Esha Jain, J. L. (2021). A COMPARATIVE EXAMINATION OF NON-PERFORMING ASSET MANAGEMENT OF BANKS IN INDIA. International Journal on Recent Trends in Business and Tourism.
[29] B M Misra, S. D. (2010). Pro-cyclical Management of Banks’ Non-Performing Loans. Bank For International Settlements.
[30] Kandpal, V. (2020). NON-PERFORMING ASSETS IN INDIA: A CRITICAL ANALYSIS OF PUBLIC AND PRIVATE SECTOR BANKS. Corporate Governance and Sustainability Review, 65-73.
[31] Boinapalli Ravindra, G. R. (2024). Impact of Non-Performing Assets (NPA) on the Profitability of Public and Private Sector Banks in India. International Journal of Research Publication and Reviews, 1873-1879.
[32] Brajaballav Pal, S. D. (2020). IMPACT OF NON-PERFORMING ASSETS (NPAS), INTEREST INCOME AND AGE OF THE BANKS ON FINANCIAL PERFORMANCE IN INDIAN BANKS. International Journal of Applied Business and Economic Research, 21-28.
[33] Sonal, K. (2018). Impact of non performing assets on profitability of public sector banks in India. ZENITH International Journal Of Business Economics and Manangement Research, 61-66.
[34] Times, T. E. (2024, August 2024). What is 'Capital Adequacy Ratio'. Retrieved from
[35] Kumar, R. (2014). Strategies of Depository Institutions. Retrieved from
[36] economictimes. (2024, June 7). RBI says India's banking sector is sound and resilient, Gross NPA is below 3%. Retrieved from
[37] 
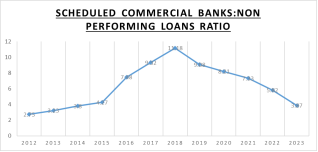
ceicdata. (2023, May 27). India Non Performing Loans Ratio. Retrieved from
[38] INDIA, F. (2024, August 1). Top 10 banks in India by market cap in 2024. Retrieved from
[39] Annual Report, H. B. (13, August 2024). Financial Disclosures. Retrieved from
[40] State Bank Of India, A. R. (2024, August 12). Annual Reports. Retrieved from
[41] Times, T. E. (2020, April 1). Check the financial health of your bank with these 8 ratios. Retrieved from
[42] Srivastava, D. N. (2024, May). Axis Bank Study. Axis Yearly Report, 1(B), 67-76.
Cite This Article
  • APA Style

    Ganjikunta, D. R., Shrivastava, N. (2024). Non-Performing Assets (NPA’s) – Impact on Financial Stability of Indian Commercial Banks. International Journal of Finance and Banking Research, 10(5), 92-103. https://doi.org/10.11648/j.ijfbr.20241005.12

    Copy | Download

    ACS Style

    Ganjikunta, D. R.; Shrivastava, N. Non-Performing Assets (NPA’s) – Impact on Financial Stability of Indian Commercial Banks. Int. J. Finance Bank. Res. 2024, 10(5), 92-103. doi: 10.11648/j.ijfbr.20241005.12

    Copy | Download

    AMA Style

    Ganjikunta DR, Shrivastava N. Non-Performing Assets (NPA’s) – Impact on Financial Stability of Indian Commercial Banks. Int J Finance Bank Res. 2024;10(5):92-103. doi: 10.11648/j.ijfbr.20241005.12

    Copy | Download

  • @article{10.11648/j.ijfbr.20241005.12,
      author = {Dia Reddy Ganjikunta and Neharika Shrivastava},
      title = {Non-Performing Assets (NPA’s) – Impact on Financial Stability of Indian Commercial Banks
    },
      journal = {International Journal of Finance and Banking Research},
      volume = {10},
      number = {5},
      pages = {92-103},
      doi = {10.11648/j.ijfbr.20241005.12},
      url = {https://doi.org/10.11648/j.ijfbr.20241005.12},
      eprint = {https://article.sciencepublishinggroup.com/pdf/10.11648.j.ijfbr.20241005.12},
      abstract = {For any economy credit is required for faster growth, but any outstanding advances may turn macroeconomic shocks. There can be various reasons for Non-Performing Assets (NPA) like low scrutiny by banks, wilful defaulter, low earnings affecting ability of entities to pay back loans, economic slowdown, government policies etc. This study aims to bridge this gap by analysing the performance and impact of NPA’s on the State Bank Of India (SBI) top public commercial bank by market capitalisation and HDFC Bank, a top private bank according to market capitalisation. For the current study, HDFC and SBI bank was considered and data for the study was collected using secondary source, i.e. annual reports. The data was collected in a time series format for different financial variables. Keeping Net NPA to Net Advances as an independent variable and Net Profit/Income Ratio and ROA as dependent variable hypothesis was formed. As per the findings, NPA significantly impact profitability of Banks’ and Debt to Asset Ratio. The impact of NPA was found to be more profound in the SBI than HDFC, but it was observed that SBI’s NPA is better managed than that of HDFC, since it made more provisions for NPA, had better loan structures and profitability metrics. It is suggested that Private Commercial Banks can maintain more provisions for NPA and better utilization of assets to reduce their Debt to Asset Ratio to mitigate the negative affect of NPA.
    },
     year = {2024}
    }
    

    Copy | Download

  • TY  - JOUR
    T1  - Non-Performing Assets (NPA’s) – Impact on Financial Stability of Indian Commercial Banks
    
    AU  - Dia Reddy Ganjikunta
    AU  - Neharika Shrivastava
    Y1  - 2024/11/13
    PY  - 2024
    N1  - https://doi.org/10.11648/j.ijfbr.20241005.12
    DO  - 10.11648/j.ijfbr.20241005.12
    T2  - International Journal of Finance and Banking Research
    JF  - International Journal of Finance and Banking Research
    JO  - International Journal of Finance and Banking Research
    SP  - 92
    EP  - 103
    PB  - Science Publishing Group
    SN  - 2472-2278
    UR  - https://doi.org/10.11648/j.ijfbr.20241005.12
    AB  - For any economy credit is required for faster growth, but any outstanding advances may turn macroeconomic shocks. There can be various reasons for Non-Performing Assets (NPA) like low scrutiny by banks, wilful defaulter, low earnings affecting ability of entities to pay back loans, economic slowdown, government policies etc. This study aims to bridge this gap by analysing the performance and impact of NPA’s on the State Bank Of India (SBI) top public commercial bank by market capitalisation and HDFC Bank, a top private bank according to market capitalisation. For the current study, HDFC and SBI bank was considered and data for the study was collected using secondary source, i.e. annual reports. The data was collected in a time series format for different financial variables. Keeping Net NPA to Net Advances as an independent variable and Net Profit/Income Ratio and ROA as dependent variable hypothesis was formed. As per the findings, NPA significantly impact profitability of Banks’ and Debt to Asset Ratio. The impact of NPA was found to be more profound in the SBI than HDFC, but it was observed that SBI’s NPA is better managed than that of HDFC, since it made more provisions for NPA, had better loan structures and profitability metrics. It is suggested that Private Commercial Banks can maintain more provisions for NPA and better utilization of assets to reduce their Debt to Asset Ratio to mitigate the negative affect of NPA.
    
    VL  - 10
    IS  - 5
    ER  - 

    Copy | Download

Author Information
  • Department of Economics, University of Illinois Urbana-Champaign, Illinois, USA

    Biography: Dia Ganjikunta is a dedicated student of Econometrics and Quantitative Economics at the University of Illinois Urbana-Champaign, with a minor in Computer Science. She has actively contributed to the Econ Data Lab, working alongside professors and peers to apply statistical techniques to real-world datasets, including a detailed analysis of Brazil’s MCMV Housing Policy with a focus on racial and justice equity perspectives. Passionate about financial consulting and strategic growth, Dia combines her expertise in data analytics and econometrics to explore innovative solutions within finance and healthcare economics

    Research Fields: MCMV housing policy, econometrics, healthcare economics

  • Global Research Hub, Bangalore, India

    Biography: Neharika Shrivastava is an accomplished academician and researcher with over 13 years' experience in teaching and research in analytics, data science, finance and economics. Holding a PhD in Finance from Birla Institute Of Technology, Mesra, Ranchi, she has worked extensively with institutions such as Google, Bank of America, and the Center for Study of Science, Technology and Policy (CSTEP). Her expertise spans quantitative and qualitative research, data analytics, and econometrics, with proficiency in SPSS, R Studio, EViews, and MS Excel. Her research contributions include several publications and presentations in national and international conferences, with a focus on environmental policy, carbon trading, and the impact of research and development expenditure on corporate profitability.

    Research Fields: Corporate governance: Analysis of different expenditures, dividend policies; carbon trading: - Process of carbon trading, impact on financial performance, pricing mechanism; Decarbonization:- Different methodologies adopted for net zero scenario within different industries, ESG Framework